EDITORIAL

COMMUNITY SPOTLIGHT

New editor Tash caught up with Lisa from Briery Hill Llamas to talk about an incredibly difficult few months – and how our community can help.
Tell us about yourselves and what you normally do?
We're a small family-run farm, centred around our much-loved llamas. We offer llama walks, animal experiences, afternoon teas, and workshops, all built around positive reinforcement training and a deep understanding of camelid behaviour. I'm also a Certified Animal Assisted Intervention Specialist, so sharing the well-being benefits of our animals is a huge part of what we do.
What happened, and why do you need community support?
Earlier this year, one of our llamas, Stardust, became seriously unwell. After weeks of care at the Royal Veterinary College, we had to make the heartbreaking decision to let him go. Tests confirmed TB, which meant mandatory testing across all our animals. Seven more llamas tested positive, and we lost them over two devastating days. Alongside the emotional toll, we've been left with vet bills nearing £15,000 and no financial support, while also being unable to run our main llama walk experiences until the end of 2026 or into 2027.
TB sounds worrying – is there still any risk when visiting?
The farm is working closely with UKHSA (which was Public health England), the Animal and Plant Health Agency, and although this only restricts animal movements on and off site we agreed to halt contact with the llamas at this time. Experiences currently on offer, such as workshops and afternoon teas, are safe to attend and do not involve contact with animals under restriction. Llama walks are temporarily paused as a precaution until the farm completes the required rounds of clear testing.

For llama farmers, a TB breakdown means income stops abruptly overnight with no further assistance from the government. They cannot sell milk, move animals, or send stock for meat, leaving businesses in limbo for months.
The restrictions imposed on camelids are also considerably longer than those applied to cattle. Camelids are tested at 90-day intervals, compared with 60 days for cattle. Additional skin and blood testing can extend this timescale further, with farmers sometimes receiving only a couple of days' notice before another testing period begins. In practice, this can add many more weeks to an already lengthy process. This is particularly frustrating because camelids are widely regarded as dead-end hosts of TB and are not generally considered significant spreaders of the disease.
How can the community help?
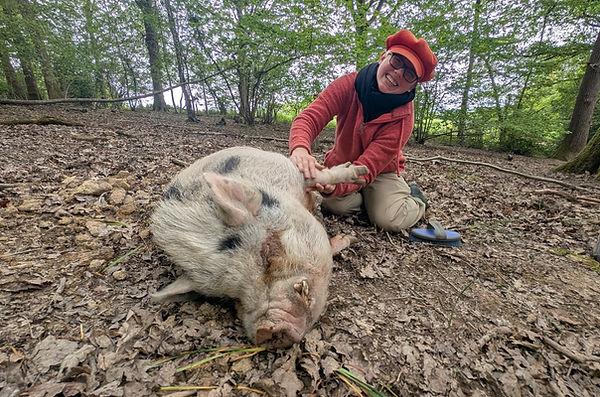
Right now, support means everything. You can help by booking; Needle felting workshops using our own llama fibre, Pig enrichment experiences or Our five-star rated afternoon teas. These not only bring in vital income but also help keep the farm going during a time when our usual activities are paused. Keep an eye out for any additional experiences or open days as we adapt.


How can we book?
Bookings can be made directly by emailing: Contact Details on PDF copy on Home Page You'll be warmly welcomed – and very well fed if you opt for afternoon tea!
Is there anything else people can do?
We've set up a GoFundMe to help cover the unexpected vet costs and ongoing care for our remaining animals, so if you want to help but an experience or workshop isn't your cup of tea, even a small donation is a big help right now. Even sharing the Facebook page makes a real difference.
Contact Details on PDF copy on Home Page or scan the QR code
How can we stay up to date?
Follow along via our Social media eg Facebook, Instagram or our website for updates, new experiences, and ways to support us through this incredibly tough time.
